library(tidyverse, warn.conflicts = FALSE)
library(fixest)
library(tinytable)Main analysis script
This is an example script that will be run by render_file and logged in the logbook.
Note
Note that there are five types of callouts, including: note, warning, important, tip, and caution.
1 + 1
mean(rnorm(1000))
[1] 2
[1] 0.05055768Plots
plot(mtcars$mpg, mtcars$hp)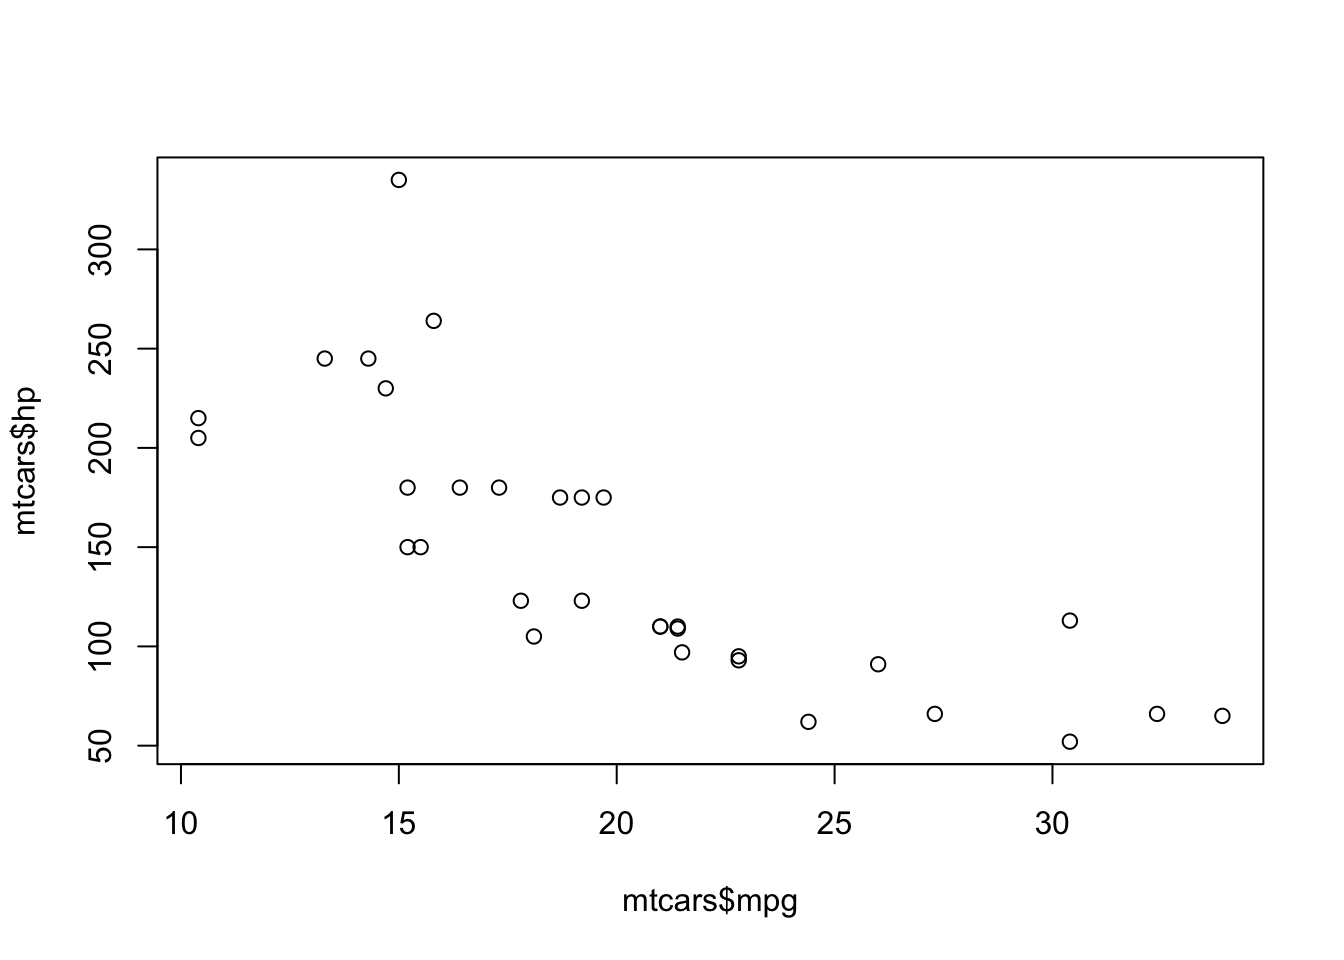
Tables
tinytable::tt(
  mtcars[1:5, ],
  caption = "First five rows of `mtcars`"
)| mpg | cyl | disp | hp | drat | wt | qsec | vs | am | gear | carb |
|---|---|---|---|---|---|---|---|---|---|---|
| 21.0 | 6 | 160 | 110 | 3.90 | 2.620 | 16.46 | 0 | 1 | 4 | 4 |
| 21.0 | 6 | 160 | 110 | 3.90 | 2.875 | 17.02 | 0 | 1 | 4 | 4 |
| 22.8 | 4 | 108 | 93 | 3.85 | 2.320 | 18.61 | 1 | 1 | 4 | 1 |
| 21.4 | 6 | 258 | 110 | 3.08 | 3.215 | 19.44 | 1 | 0 | 3 | 1 |
| 18.7 | 8 | 360 | 175 | 3.15 | 3.440 | 17.02 | 0 | 0 | 3 | 2 |
Regression
est = feols(mpg ~ hp | cyl, mtcars)
esttable(est)
est
Dependent Var.: mpg
hp -0.0240 (0.0153)
Fixed-Effects: ----------------
cyl Yes
_______________ ________________
S.E.: Clustered by: cyl
Observations 32
R2 0.75386
Within R2 0.07998
---
Signif. codes: 0 '***' 0.001 '**' 0.01 '*' 0.05 '.' 0.1 ' ' 1